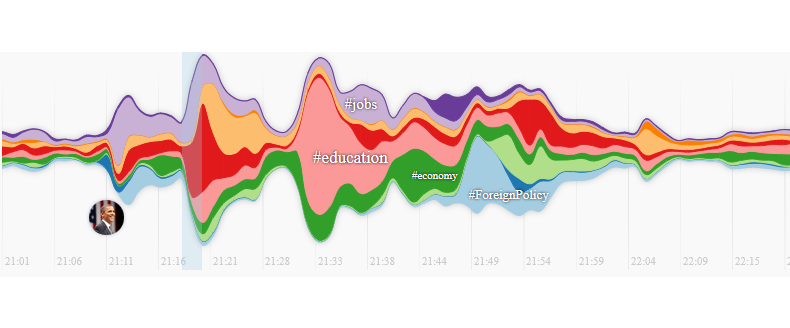
Still got #SOTU fever? Twitter’s got you covered, with a cool interative visualization of the Twitter discussion around the President’s State of the Union speech to Congress and the nation last night. You can get the flavor in the image above — the online application ties a timeline of the speech to a chart of the volume of discussion around the dominant hashtags used alongside #SOTU and #SOTU2015. Bonus: click on the timeline to jump to a transcript and video clips to see what President Obama said that sparked the online conversation.
A couple of quick observations: note the big spikes around certain hashtags, notably #education, #energy and #cybersecurity but also the steady buzz around topics like health care and the economy. Also note the quick drop-off during the Republican response; people really do tune out once a President is done talking.
With the online rapid response to the speech more and more a part of the story, particularly as activists and activist groups try to shape the next day’s media discussion, visualizations like this help us get a sense of the topics that resonate with Twitter’s audience. A caveat, of course: with groups TRYING to shape the discussion, a data visualization like this one may tell us more about activists’ priorities than it does about how the broader public reacted. Check it out and see what conclusions you can draw.
– cpd