Epolitics.com contributor Jesse Bacon follows up on his earlier post about email acquisition with some insight into a key question: which acquisition channels yield the best donors? This piece also appeared on the PowerThru Consulting blog. Drew Hudson and Laura Packard contributed writing and research to this post. Go Team!
The question I have been asked the most after my first post on email acquisition performance for a non-profit by channel used to acquire them*, “Interesting, but how does it affect fundraising?” After all, all good organizing needs to pay for itself and online fundraising is some of the most efficient around for both political campaigns and non-profits. So inquiring readers want to know how the differing performance I found in new members acquired from Facebook ads, list buys, and list swaps (joint actions) translate into fundraising efforts.
The answer is that the same trend applies in non-profit fundraising emails: joint actions performed far better than either paid list buys or Facebook ads for email acquisition in terms of donations.
Let’s start with the basic counts. Over the last 18 months (June 2013-Mar 2014), our environmental advocacy-focused non-profit client Environmental Action added about 150,000 new members from either ads, swaps or paid acquisition. Those members, in turn, donated $153,039.24 – or just about $1 for each new member added to the list. But not all segments performed equally.
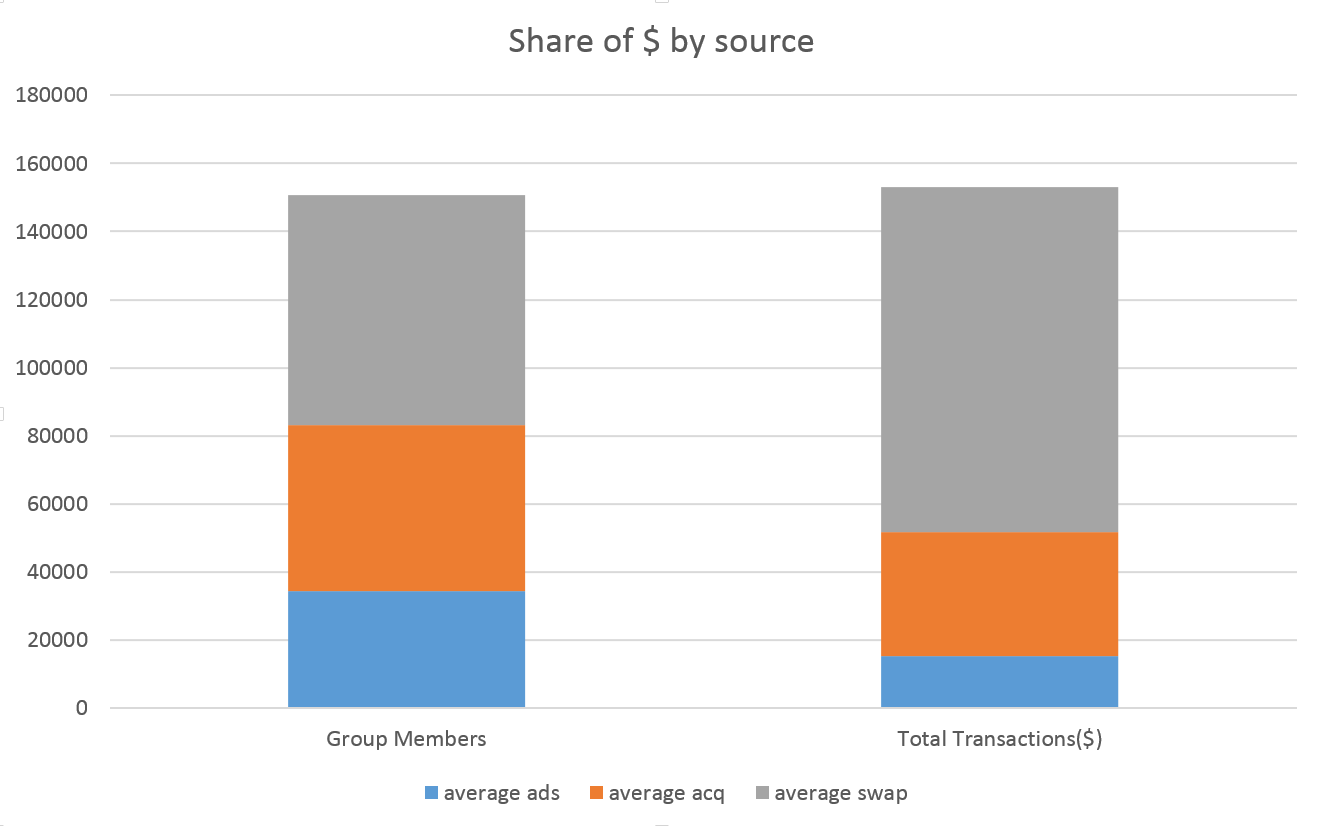
If you look at the first bar of this graph on the left, you can see the emails acquired by each source, with the total bar adding up to all 150,000 new members. As you can see, the swaps group is a little bit bigger, but each segment is over 30,000 records. here’s the counts for those of you with your number-crunching hats on:
Ad members 34,308
Acquisition members 48,742
Swap members 67,794
Total: 150844
The bar on the right shows how much of the total fundraising each segment contributed. You can see right away that Share members are over-performing, accounting for 45% of the new members, but 66% of all the funds raised. Facebook ads performed the least-well, accounting for 22% of the new members in this period, but only 10% of the funds raised.
Now I will take a closer look at how the average member in each segment performed. For each of the next graphs we’re looking at the same sample of donors – people added in last 18 months, based on which channel they came in from. And we’re measuring donations made anytime in that same time period.
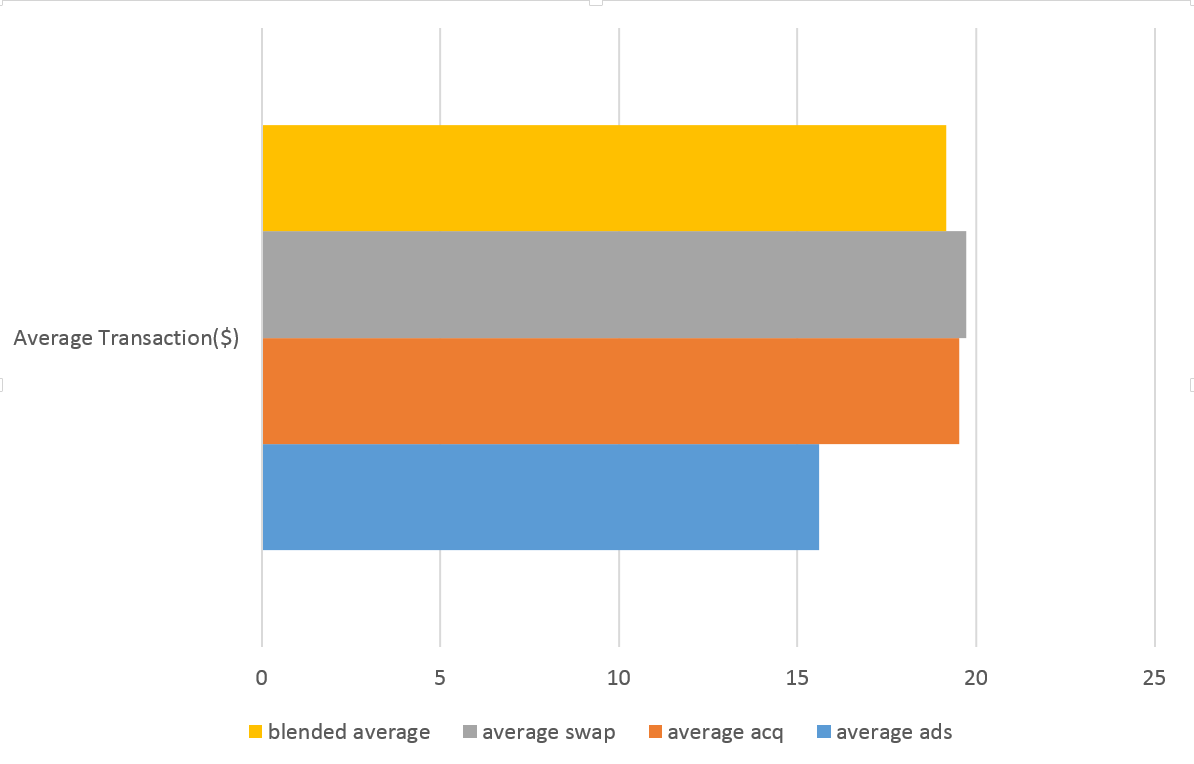
You can see that Swaps and Acquisitions both performed about the same in terms of the average gift a member gave (between $19 and $20). But the Facebook members were less generous, with an average gift just over $15.
The result for donor yes rates have an even more pronounced pattern.
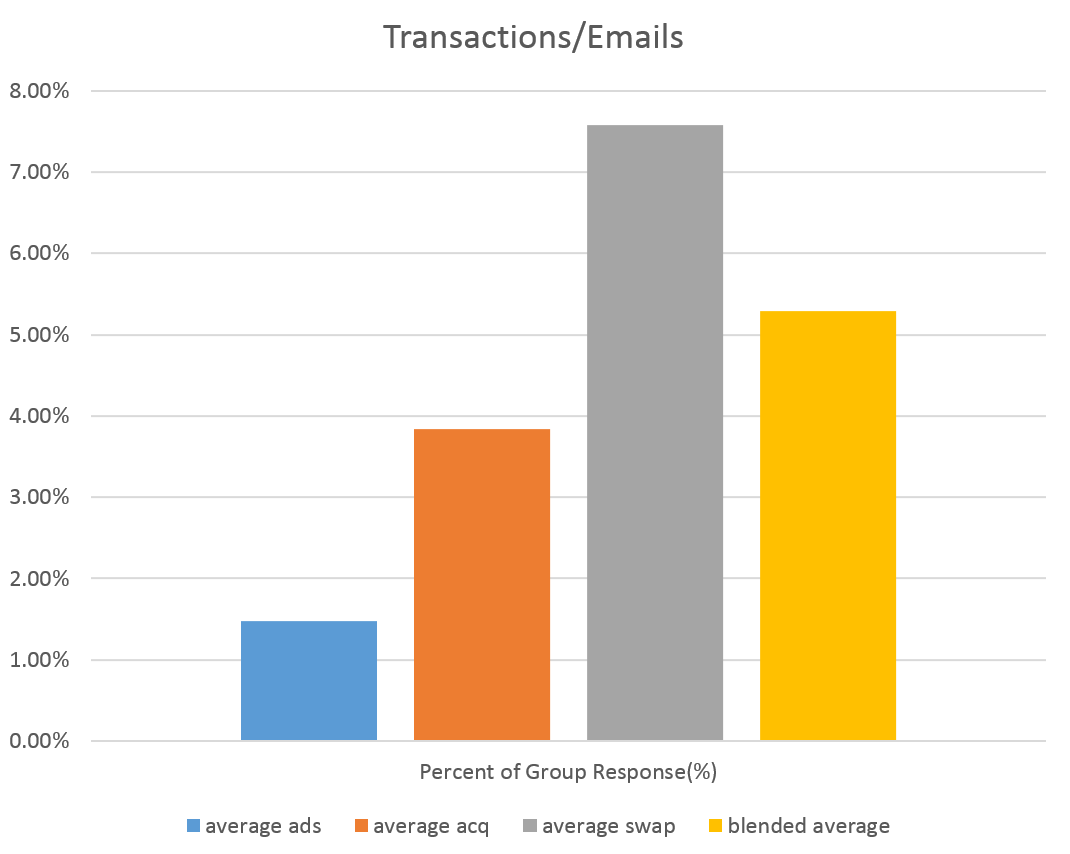
The swaps group again paces the field with a 7.58% yes rate, compared with 3.84% for acquisitions and 1.48% for Facebook ads. For comparison, the annual M+R/NTEN study pegs overall online fundraising response rates at 0.07% – so actually, any of these numbers are quite good! And Facebook recently turned on new demographic targeting, including an option to target “people who donate to liberal causes”. Going after this segment of users may boost your fundraising results.
In conclusion, the data from these different sources shows that joint actions/partnerships are an excellent way of getting donors for your non-profit or political campaign with the highest resulting rate of members saying ‘yes’ to donating and the largest average donation amounts. Paid acquisitions and Facebook ad acquisitions vary a lot more, but can still beat industry standard metrics if done right. So give a lot of thought (or ask some experts for advice) when you are considering investing money in ads or list buys to grow your online membership.
So how important is fundraising performance to the process of adding new members? Since Facebook ads can be significantly cheaper than other paid options (and don’t have a large minimum buy), you might be willing to accept a lower donation rate – even if you want the program to pay for itself in a year or two. But the program will need to be monitored closely – with daily and weekly reporting and a lot of attention to what works and how the members perform on your list. Otherwise, you risk spending ‘too much’ (eg more than you can raise from that group in 12-24 months), even if you’re only spending $.75 or $.80/record. Keep in mind this is only if you’re considering new members in terms of donations, setting aside the value of online and offline activism.
Similarly, since CPA-based list acquisition is typically more expensive ($1-$2/record is normal) you should be sure that you are buying from a trusted source, and that you are acquiring enough records to ensure at least some donations. Given that even the best performing segments say ‘no’ more than 90% of the time, you need a diverse range of healthy list growth strategies to give you a lot of new members so you can engage them, including in your non-profit’s fundraising work.
*The other common question is, what are the points on the x-axis? Answer: they are the emails 1-5 that I surveyed.